
Details
Description
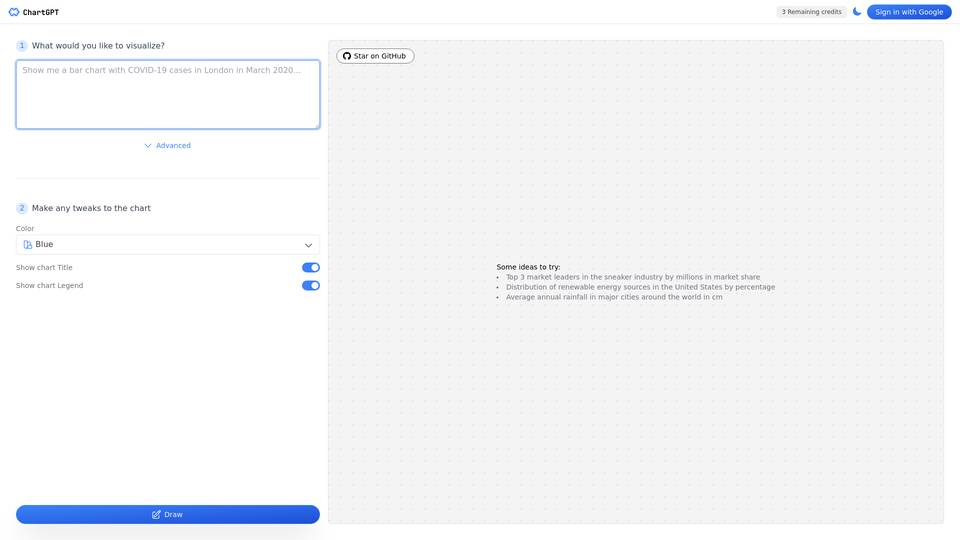
ChartGPT is an AI tool that can transform text into visually appealing charts. Users can input the desired visualization they want, make adjustments such as choosing colors, displaying titles and legends, and even add a star on GitHub for collaboration. With ChartGPT, users can effectively present data in a graphical format without the need for complex data analysis or visualization software. This tool can have various applications, such as creating charts to showcase market leaders in an industry, visualizing the distribution of renewable energy sources, or comparing average annual rainfall in different cities worldwide. ChartGPT offers a user-friendly interface and simplifies the process of creating eye-catching charts for different purposes.
Link
-
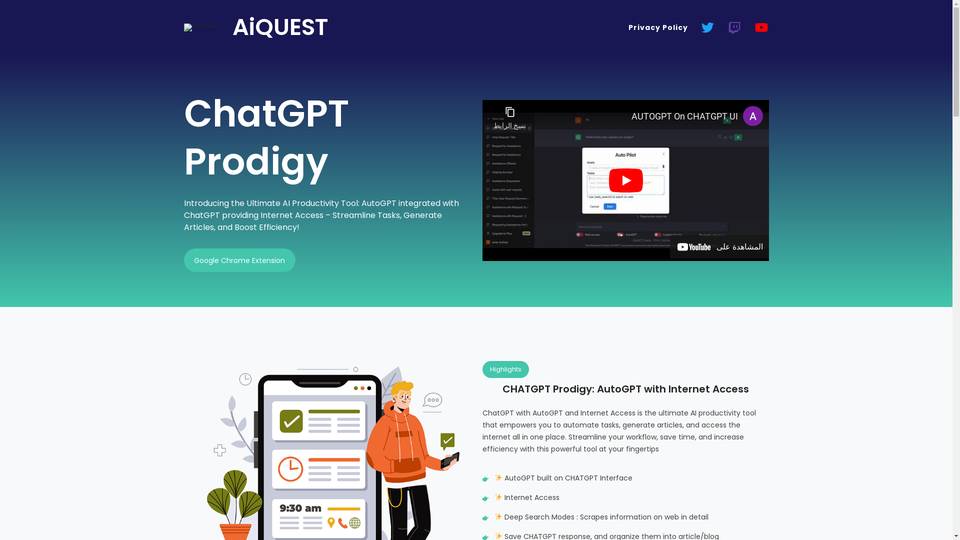
ChatGPT Prodigy: AI-powered productivity and research tool with internet access.
-
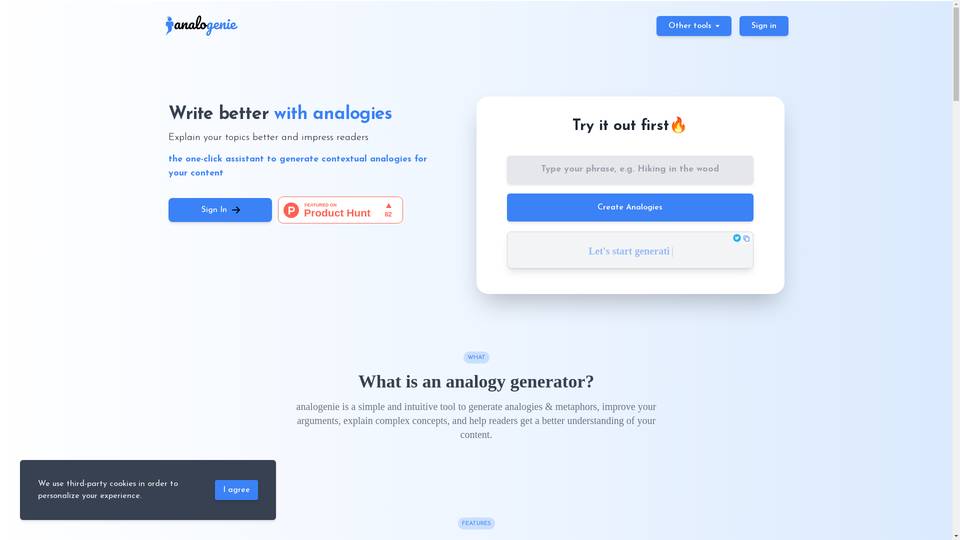
AI tool for generating contextual analogies to enhance written content.

-
AI financial problem-solving tool with personalized recommendations.
-
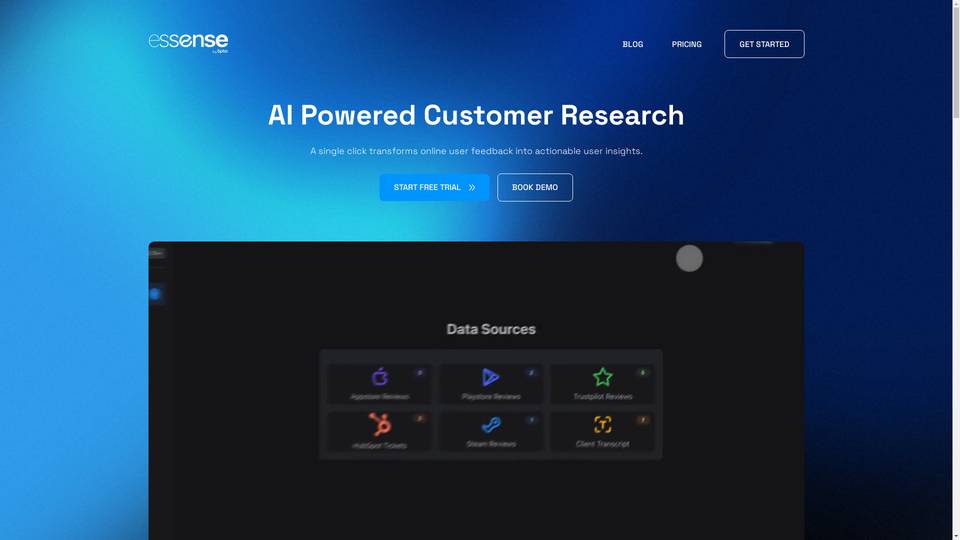
AI-powered customer feedback analysis tool.
-
AI-powered form builder tool.
-
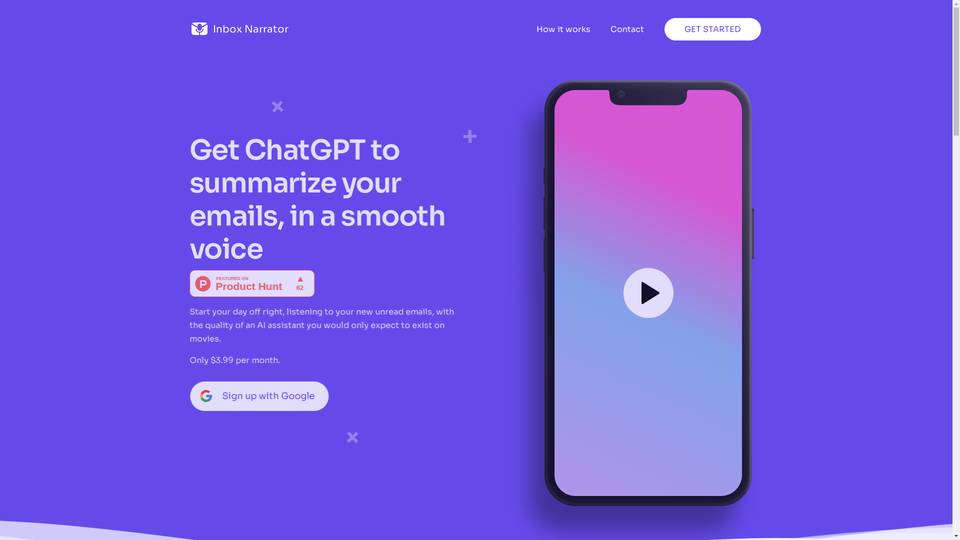
Inbox Narrator: AI-powered email summarizer for voice assistants.
-
A powerful AI tool for scientific text analysis and research optimization.
-
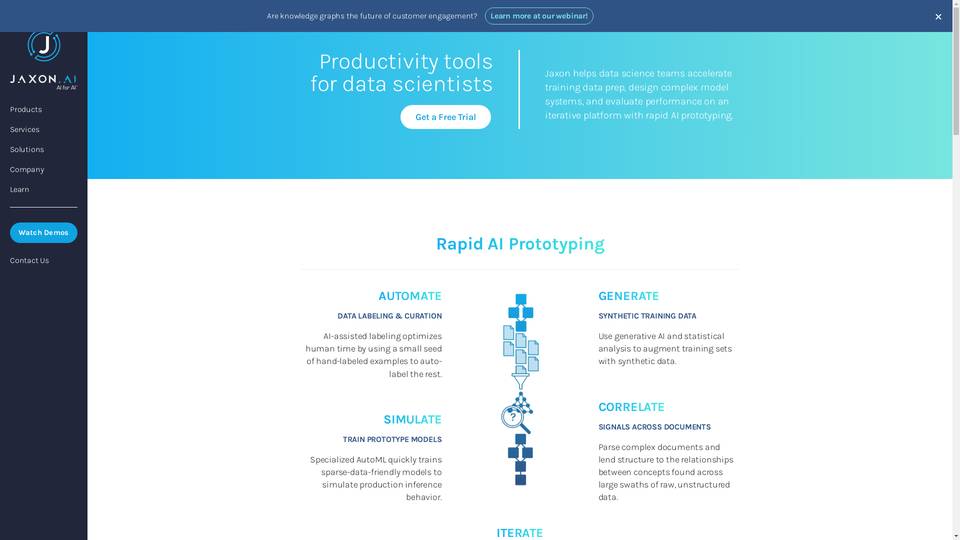
A platform for rapid AI model development and data analysis.