
Details
Description
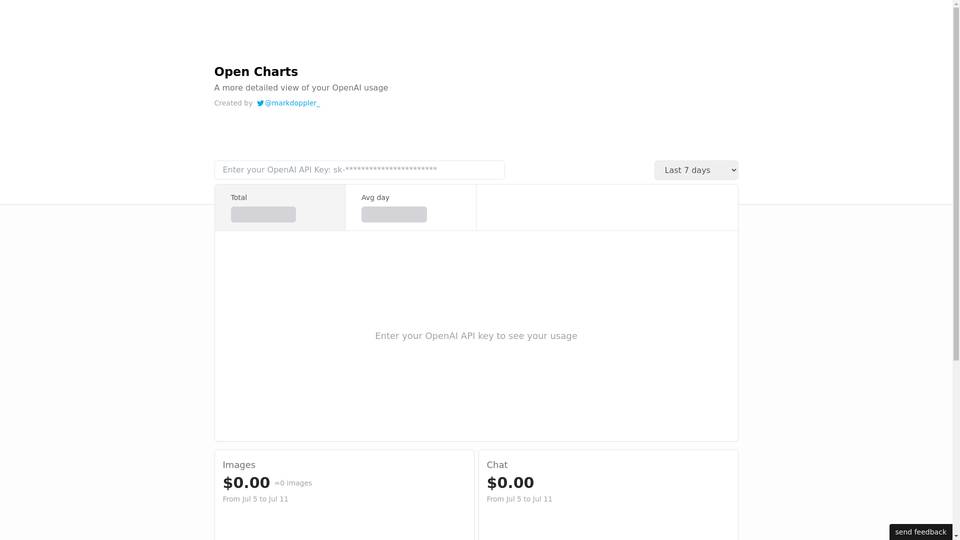
OpenAI Charts is a tool created by @markdoppler_ that provides a detailed view of OpenAI usage. It allows users to enter their OpenAI API key and see their usage over different time periods, including the last 7 days, 14 days, 30 days, 2 months, and 3 months. The tool displays usage data in different categories, such as images, chat, embeddings, and instruct models, along with the associated costs. One unique feature of OpenAI Charts is its ability to provide a breakdown of usage and cost information for specific APIs. This tool can be used by developers or organizations to monitor and analyze their OpenAI usage, track costs, and optimize resource allocation.
-
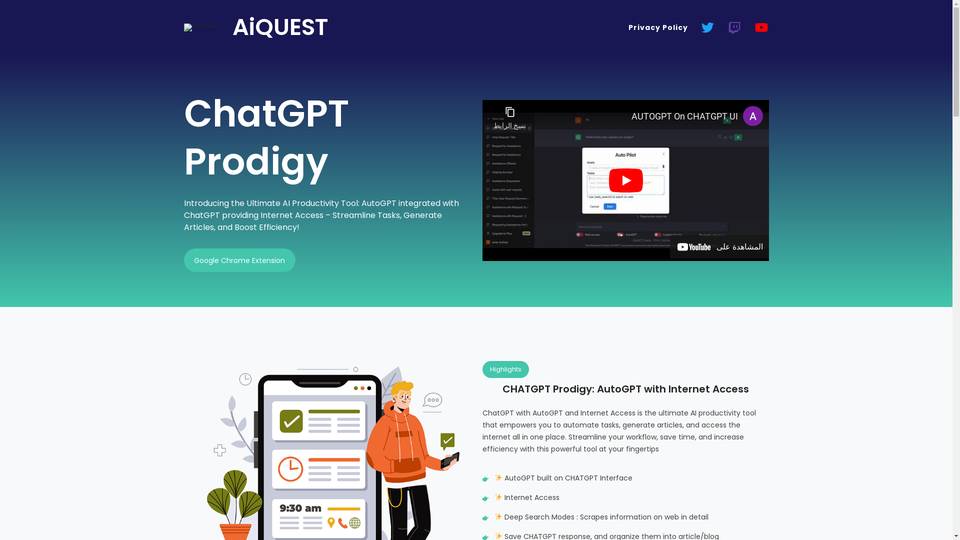
ChatGPT Prodigy: AI-powered productivity and research tool with internet access.
-
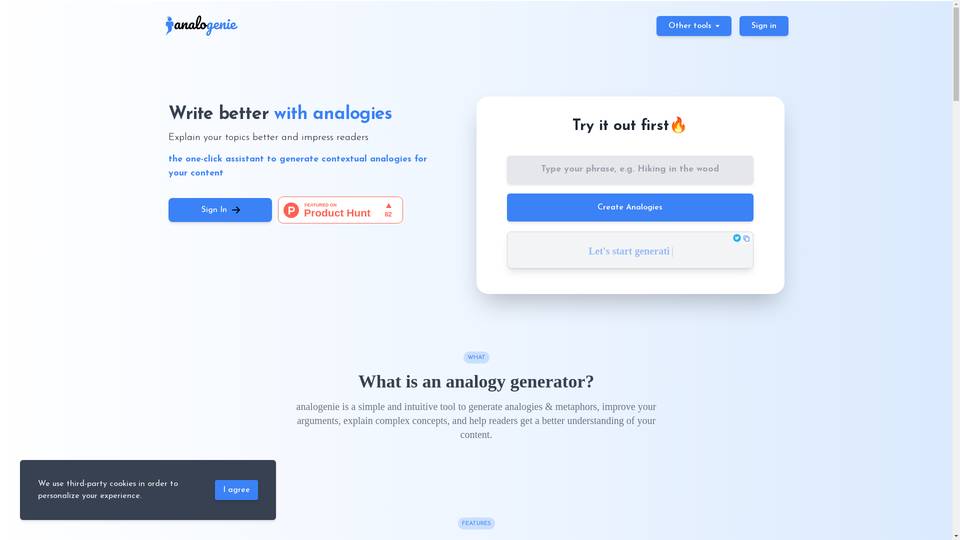
AI tool for generating contextual analogies to enhance written content.
-
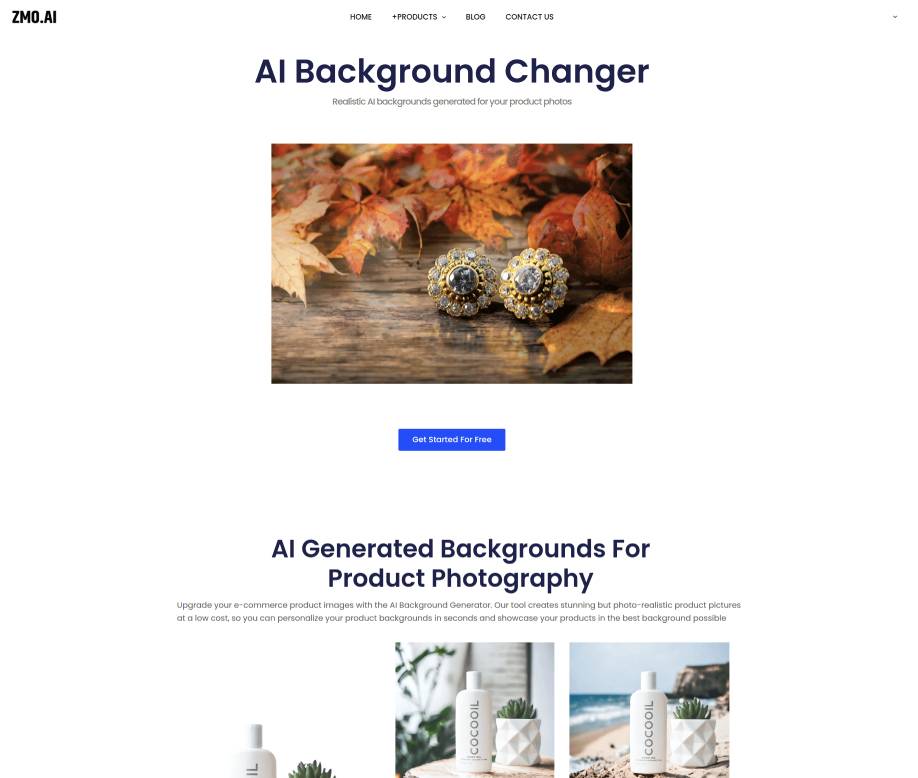
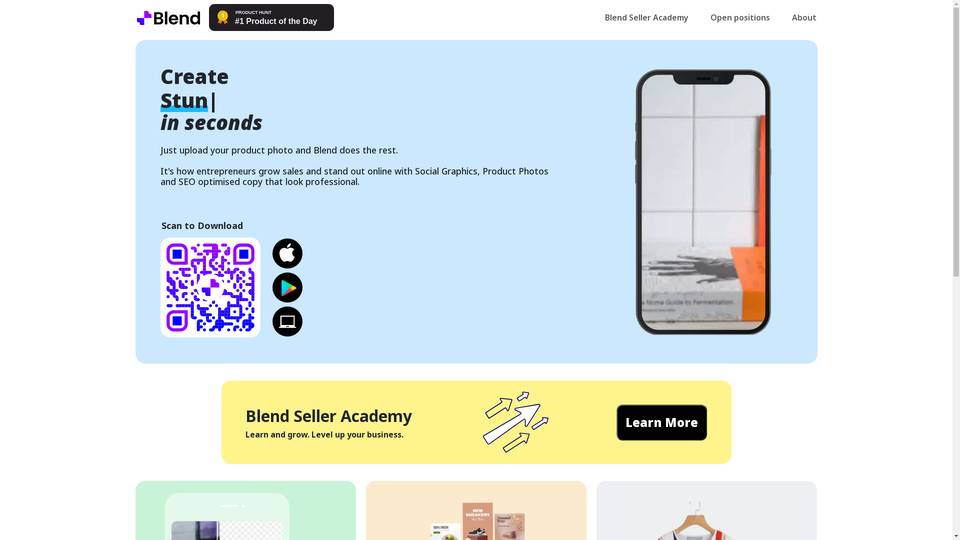
An advanced AI tool for upgrading product images with customizable backgrounds.
-
An AI tool for background removal and graphic enhancement.
-
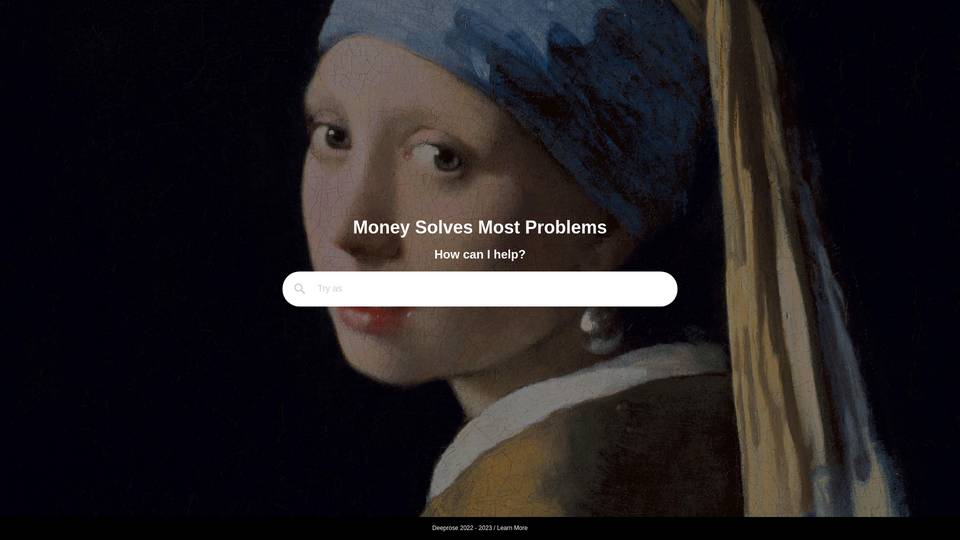
AI financial problem-solving tool with personalized recommendations.
-
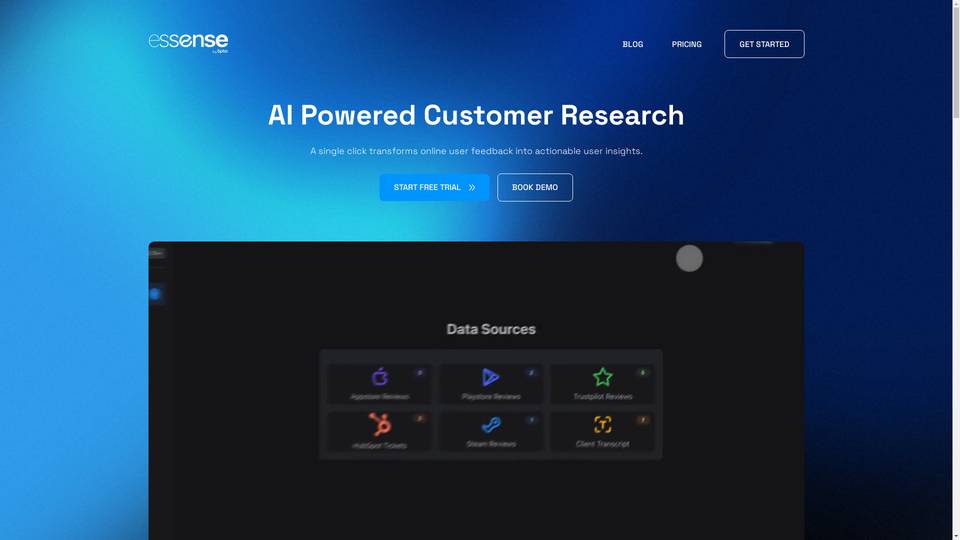
AI-powered customer feedback analysis tool.
-
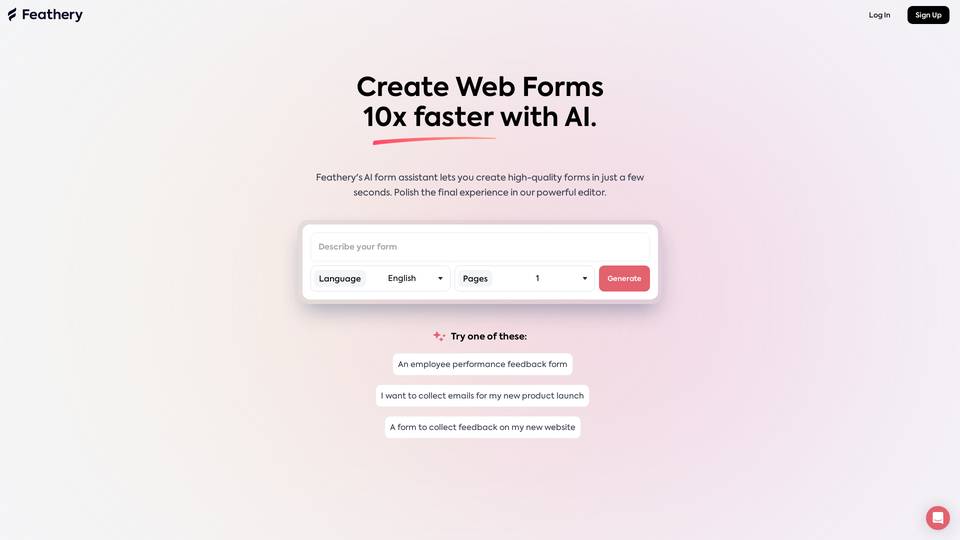
AI-powered form builder tool.
-
An AI tool bridging human intelligence with AI capabilities to streamline communication and enhance productivity.